Case study — portfolio project
Terroir
A land-suitability analysis for Bay of Plenty kiwifruit horticulture, built entirely on real New Zealand government geospatial data.
Most portfolio projects run on synthetic data. This one doesn’t.
Terroir is built on real official sources: cadastral parcels from LINZ, soil properties from S-map/LRIS, land cover from LCDB, and climate records from Open-Meteo. That means real data-quality problems along the way — which I found, diagnosed and fixed in the open, visible in the commit history rather than smoothed over.
The section below covers six of those problems in plain language.
-
22,834parcels ingested
-
16,072parcels scored
-
4territorial authorities
What we found along the way
Real government data comes with real problems. Here’s what broke, and how I caught each one.
-
01
A coordinate system that lied about itself
One of the map data sources said it used WGS84, the coordinate system used worldwide (including by GPS) — but it was actually using New Zealand’s own local system, NZGD2000, instead. That mismatch went unnoticed until it caused two datasets to line up incorrectly, shifting parcels off their real-world location. I fixed it by checking every new data source’s coordinate system against its own documentation, rather than trusting the label it shipped with.
-
02
A join key that wasn’t actually unique
The government dataset’s own ID field (parcel_id) looks like it should uniquely identify each piece of land, but it doesn’t: when several people legally share ownership of one block (cross-leases, unit titles), that same ID gets reused across all of their records. Combining datasets using that ID silently let one property’s data overwrite another’s, with no warning anything had gone wrong. I switched to a different ID field, and double-checked that this one really was unique before relying on it.
-
03
A macron silently deleted a whole district
Ōpōtiki — like many NZ place names — carries a macron. The plain-ASCII text filter used to select territorial authorities didn’t match it. No error, no warning: Ōpōtiki District was simply absent from the analysis from day one. I only found it when I compared the filtered list against the full set of source districts and saw the gap.
-
04
An off-by-one that misfiled 19% of parcels
The function that sorts parcels into Excellent/Good/Marginal tiers had a boundary error — a score sitting exactly on a tier edge landed one tier lower than it should have. It misclassified roughly 19% of scored parcels before I caught and corrected it.
-
05
A geographic scope that missed a growing region
The initial scope covered three districts. I missed Whakatāne. I only realised later, remembering that I’d worked in Edgecumbe and that there are orchards in that district I hadn’t included. Rather than assuming the remaining neighbouring districts had no orchard land, that was confirmed empirically using the land-cover dataset itself — the evidence, not an assumption, closed the question.
-
06Most significant
The same plot of land, counted several times over
While building a Power BI dashboard, I noticed thousands of rows sharing the exact same map location — one physical block of land appearing dozens of times in the data. Two separate issues were causing it: roads and waterways that had slipped into the dataset even though they were never farmland, and multiple ownership records for the same block of land (similar to the mix-up in finding 02) each being counted as if it were a separate property. Fixing both brought the total from 21,491 down to a more accurate 16,072 scored parcels, while still keeping track of how many owners each block has, instead of just throwing that detail away.
Methodology
Weighted by what actually varies, not by assumption
Each parcel’s suitability score combines four soil properties: soil order, soil texture, soil drainage, and soil depth. The weights — 40/40/10/10 — reflect which factors actually vary meaningfully across the region’s real data, not which factors are assumed to matter most in theory. Point values are grounded in established NZ kiwifruit agronomic research.
Parcels are grouped into three suitability levels — Excellent, Good, Marginal — rather than forced into a fine-grained ranking, since a large share of parcels genuinely tie at the top score. That tie is itself a finding about the region’s geology, not a modelling shortcut.
Full methodology on GitHub →Score weighting
Key results
The region’s land is more suitable than expected — and unevenly so
Region-wide suitability breakdown
- Excellent
- Good
- Marginal (5.7%)
Of the 16,072 scored parcels, 78.4% land in the Excellent tier — a reflection of the Bay of Plenty’s naturally favourable volcanic soils for kiwifruit, not a lenient scoring model.
Suitability by subzone
These 5 subzones are a smaller grouping used to compare with Apophenia (the sister project) — they don’t map one-to-one onto the 4 districts shown above.
- Katikati: 89.3% Excellent, 9.4% Good, 1.3% Marginal
- Te Puke: 91.3% Excellent, 6.6% Good, 2.2% Marginal
- Tauranga: 88.7% Excellent, 9.3% Good, 2.0% Marginal
- Pongakawa: 83.1% Excellent, 10.1% Good, 6.7% Marginal
- Ōpōtiki: 56.1% Excellent, 27.3% Good, 16.7% Marginal
Katikati, Te Puke, and Tauranga cluster near 90% Excellent. Pongakawa runs meaningfully lower, and Ōpōtiki is the clear outlier — barely over half its parcels land in the Excellent tier, with the highest Marginal share of any subzone.
Expansion candidate parcels
Parcels with good soil that aren’t currently under orchard or vineyard use — a real, data-grounded answer to “where could this industry grow”. This reflects physical land suitability only, not investment readiness: it doesn’t model irrigation access, licensing, or land-use change.
Cross-project comparison with Apophenia
Illustrative pattern, based on just 5 subzones.
Soil suitability shows a strong negative correlation with Apophenia’s synthetic risk indicators, most closely with Psa disease incidence (a serious bacterial disease that damages kiwifruit vines) — in other words, subzones with better soil tend to show lower simulated disease risk.
Read this carefully
Apophenia’s risk data is synthetic and illustrative, so this demonstrates cross-project analytical technique — not a validated real-world finding. With only five subzones, it’s also far too small a sample for statistical confidence regardless.
Dropping Ōpōtiki, the strongest outlier, brings the correlation to r = −0.76 across the remaining 4 subzones, rather than collapsing it — but with a sample this small, one subzone still carries visible weight.
Climate risk
Frost risk
Negligible
Across the whole region.
Chill hours
Meaningful coastal vs inland variation.
Heavy-rainfall frequency
Ōpōtiki sees the highest frequency of the five subzones, though all sit within a fairly narrow band.
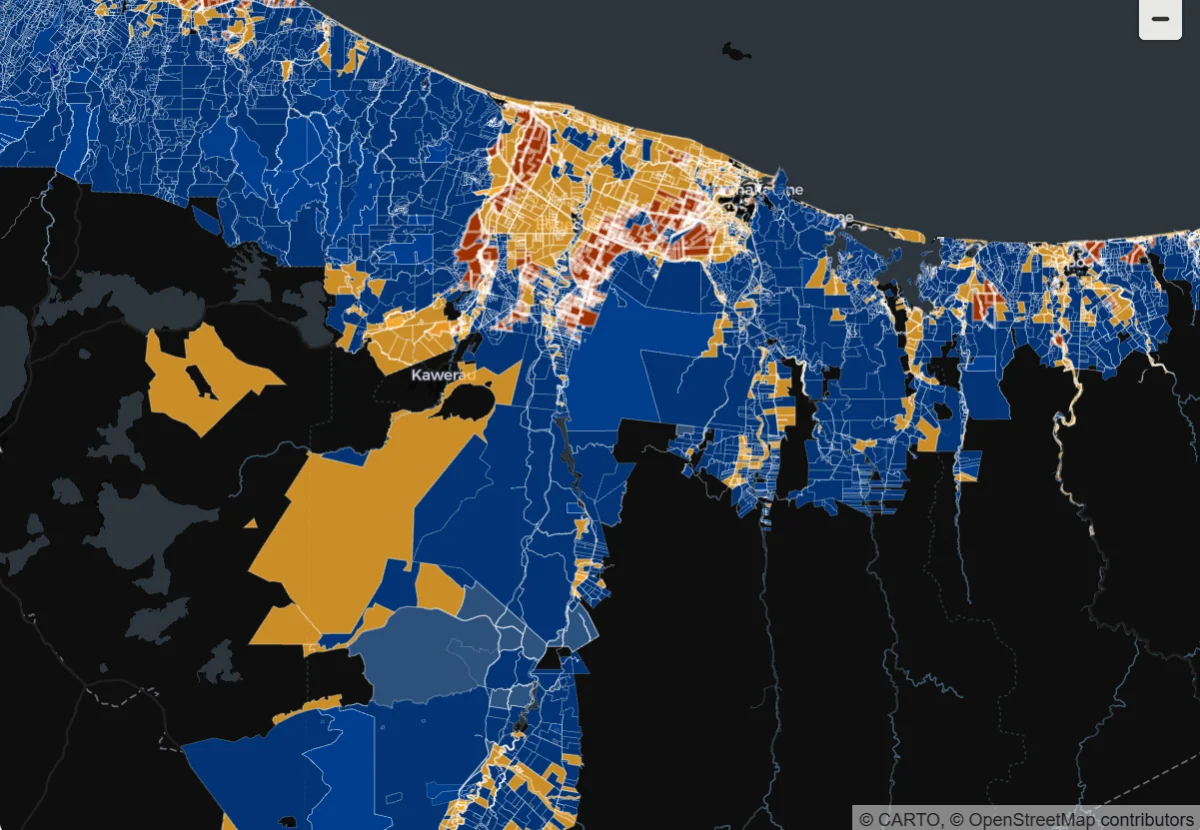
Suitability map
Every scored parcel, mapped
Limitations
What this model doesn’t cover
-
Flood risk
Elevation-based flood modelling (using a Digital Elevation Model, or DEM) is excluded in favour of soil drainage class — elevation alone isn’t a reliable flood indicator without full hydrology.
-
Water-holding capacity
Approximated via soil texture and drainage, since the direct dataset isn’t freely available.
-
Wind exposure and disease risk
Wind exposure and Psa disease risk aren’t modelled in Terroir itself.
-
Slope and machinery access
Slope and machinery operability aren’t modelled.
-
Irrigation access and varietal licensing
Irrigation access and Zespri varietal licensing aren’t modelled — this is why “expansion candidates” reflects physical suitability, not investment readiness.